
Measuring soil greenhouse gases for agricultural carbon credit projects serves two important purposes that occasional spot sampling cannot. The first is measurement continuity, enough to capture the peaks that follow changes in external conditions, such as after rain or after fertilizer application. The second is the ppb-level precision of continuous measurement data, which can be used to quantify emissions accurately, including the amount of N₂O. Even a small amount of N₂O has a large effect on global warming.
There are currently two main approaches: a gas analyzer connected to a chamber for continuous measurement, and a multi-chamber system installed permanently in the field to collect data for a whole season without anyone on site.
Why measurement continuity matters more than you might think
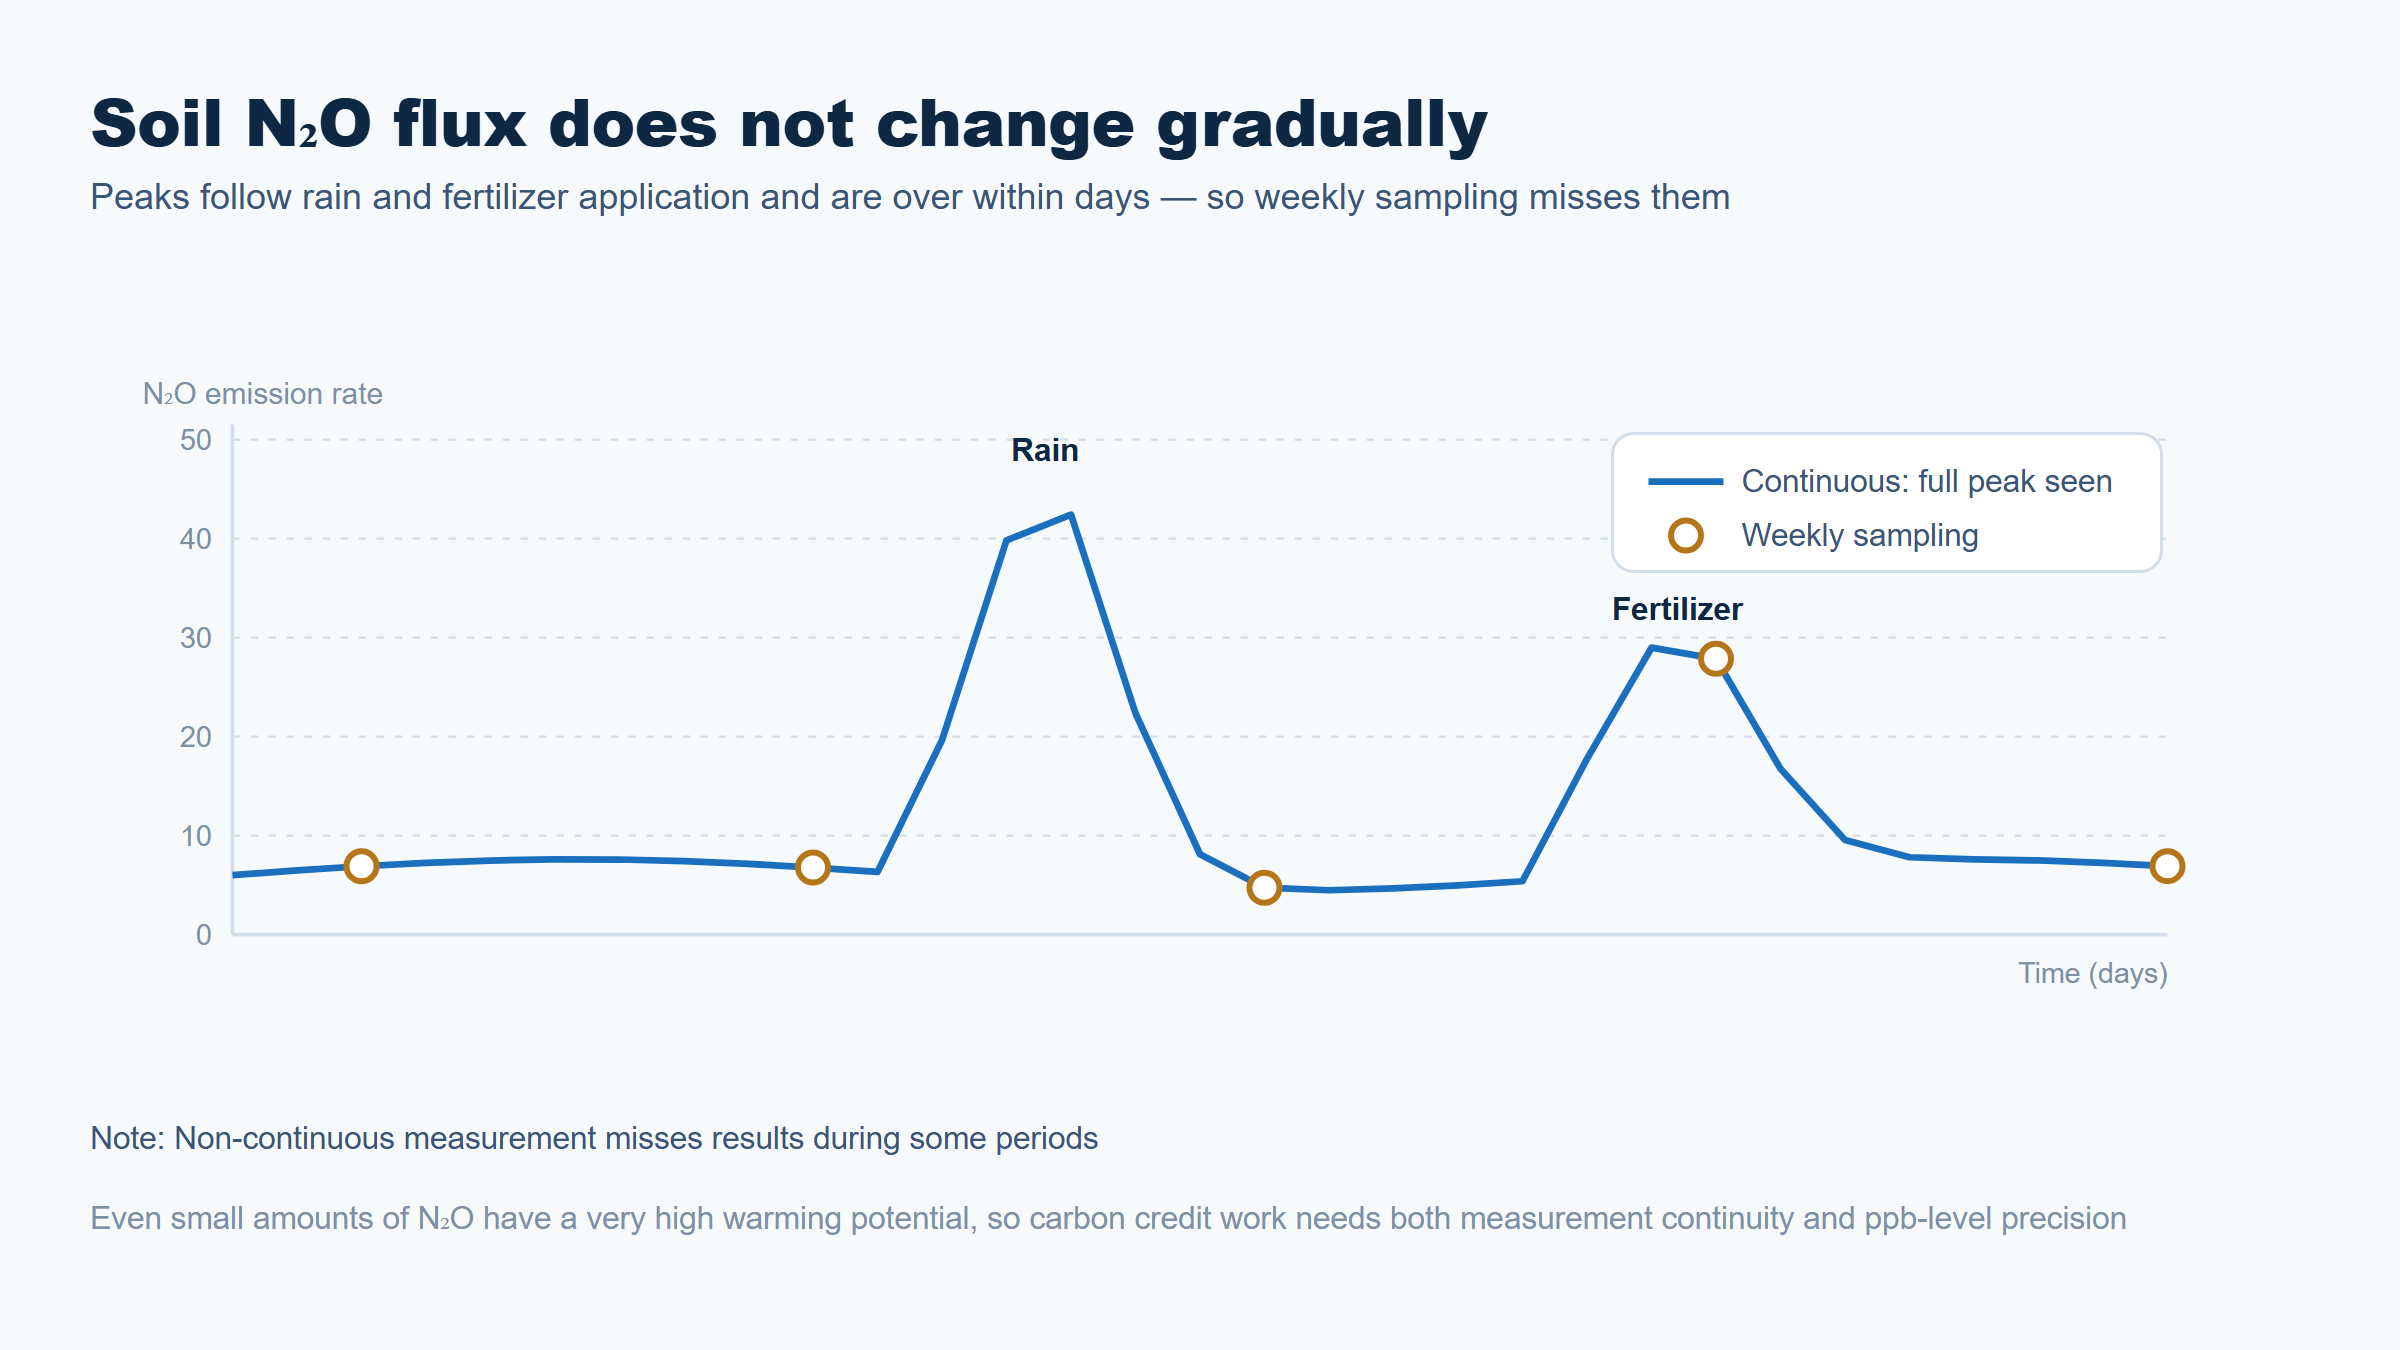
Soil gas flux does not change gradually. It rises and falls very quickly in response to events in the field, especially rain and fertilizer application. If data points are too far apart, the figures you get are an average of the quiet periods, not a true picture of the whole season.
In Picarro test documentation, rainfall was simulated in a closed chamber system. After water was added to the soil, the N₂O emission rate tripled within 2 minutes and kept climbing. CH₄ spiked and then gradually fell, while CO₂ was first suppressed and then recovered.
Note that the three gases responded to the same event in different ways and at different times. This is why measuring one gas and inferring the others does not work, and why measurement frequency becomes a technical requirement, not just a matter of convenience.
In practice, if your project will report figures that must stand up to verification, you first need to show whether your data cover the peak periods, not just how many data points you have.
Which gases need to be measured
The three main gases for agricultural soil flux work are N₂O, CH₄ and CO₂. Each comes from a different process in the soil and responds differently to field management. Choose the full set your project has to report, not whatever the instrument happens to measure.
N₂O needs the highest precision. Its atmospheric concentration is very low, but its global warming potential is high. Capturing its rate of increase in a chamber over a short period therefore requires an instrument that reads at ppb level.
NH₃ and H₂O can also be measured, but they have limitations you should know before planning. Both adsorb onto equipment surfaces, so readings respond more slowly than the real change, and they carry over between measurements. The design of the gas sampling system therefore matters more for these two than for the other gases.
Approach 1 — An analyzer connected to a chamber for continuous measurement
This approach suits work that needs to show real dynamics over short periods, such as research that must explain mechanisms, or projects that must prove a change in field management really reduces emissions.
Picarro G2508 measures five gases at once in a single instrument: N₂O, CH₄, CO₂, NH₃ and H₂O. It uses CRDS and gives a new reading every 8 seconds or less. N₂O precision at 5-minute averaging is about 0.6 ppb, and water vapor effects are corrected automatically, so it can be connected to a soil chamber and log continuously right away.
The point to check during planning is what is feasible on site. The instrument weighs 22.6 kg, runs on 100–240 V mains power and operates at 10–35 °C. It therefore needs a location with reasonable temperature control and a stable power supply. It can be used in the field as long as its temperature is kept within the specified range (10–35 °C).
Approach 2 — A multi-chamber system installed in the field
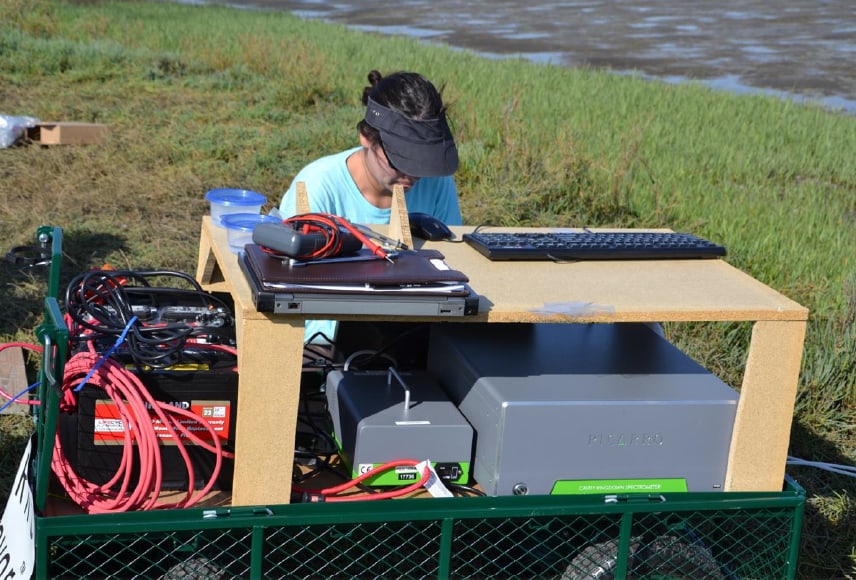
If the goal is to collect data for a whole season without sending staff to watch over it, this approach is a better fit. It is designed to stay installed in the field and run on its own for months.
LICA SF-9000 connects to anywhere from 1 to 18 chambers. It measures CO₂ over 0–6,000 ppm with accuracy better than 1% of reading, and logs data continuously to an SD card with no staff on site. It operates from -20 to 60 °C, which comfortably covers field conditions in Thailand.
The benefit goes beyond saving labor. Because several chambers can be connected at once, the system covers spatial variability within a plot better than a single measurement point. Data reviewers often ask about this, because soil in the same plot does not emit gas equally at every point.
Approach 3 — A portable instrument for surveying many sites
Some projects are not yet ready for a permanent installation, but need to survey several plots to find where a measurement system should actually go. This work needs an instrument that can be carried anywhere and started up quickly.
LICA PS-9600 is a portable instrument that uses a CRDS laser to measure CH₄, CO₂ and H₂O at the same time. CH₄ precision is no more than 1.2 ppb at 10-second averaging, and 0.6 ppb at 100 seconds. The instrument weighs 8 kg and operates from -20 to 50 °C.
The most cost-effective way to use it is as a survey step first, to decide where to invest in a permanent system, instead of guessing and installing it in the wrong place.
Isotope work — when you need to know where the carbon comes from
Some projects do not only ask how much is emitted. They ask where the detected carbon or water comes from. That is a different question, and it needs a different kind of instrument.
Picarro L2140-i is used for water isotope work and lets you choose a mode to match your workload. Standard mode handles 27 samples per day. Express mode handles up to 50 samples per day for δ18O and δ2H. Survey mode gives rough estimates at up to 900 injections per day, so samples can be grouped first to reduce memory effects in the actual measurement run.
Picarro lists special options, including running Express together with Survey, which cuts the measurement time for 100 samples by up to 68 hours. For work that requires 17O-excess, the instrument reaches a precision of 15 per meg (0.015‰), a level that previously required a specialized IRMS laboratory.
Which approach suits which kind of work
The three approaches above do not compete with each other. Each one answers a different need. The table below shows where to start based on the type of work you do.
| If your work is to | Start with | Why |
|---|---|---|
| See real-time dynamics and report all of N₂O, CH₄ and CO₂ | Picarro G2508 | Measures five gases at once, a new reading every 8 seconds or less, ppb-level N₂O precision |
| Collect data for a whole season in the field, with no one on site | LICA SF-9000 | Connects 1–18 chambers, logs to an SD card on its own, withstands -20 to 60 °C |
| Survey several plots to decide where to install a system | LICA PS-9600 | Portable, weighs 8 kg, measures CH₄, CO₂ and H₂O with a CRDS laser |
| Show where carbon or water comes from | Picarro L2140-i | Isotope work, with modes to match your workload, from 27 to 900 injections per day |
If you are still unsure, the quickest way is to start with three questions: which gases do you have to report, how many points will you measure, and how many seasons will the project run? These three answers alone rule out most of the options.
What to plan beyond the instrument
A budget that covers only the analyzer is often not enough. A flux measurement system has other parts that are just as necessary, and they are often thought of too late.
- Number of chambers — this sets both the cost and the credibility of the data, because too few measurement points will not cover the variability within a plot.
- Power supply — for systems installed in the field, plan from the start where the power will come from and what the backup is during outages, because data lost in mid-season often cannot be recovered.
- Data storage and retrieval — systems that log to an SD card need regular visits to collect the data. Decide who does this and how many weeks apart.
- Equipment inspection visits — equipment in the field is exposed to rain, sun, dust and animals. Set a fixed inspection schedule, rather than visiting only after data has been lost.
- Raw data management — a full season of continuous data is a large volume. Agree from the start where it will be stored, who will process it and what format it must be delivered in.
Designing a flux measurement plan that produces usable data is as much a research task as an instrument task. You need to decide how many points to use, how often to measure and how to handle the raw data. Thai Unique’s team are PhD-level specialists based in Thailand, so we can help from the measurement-plan design stage, not only when the instrument is installed.
If you would like our team to help assess which approach suits your project, send us the number of measurement points, the gases you need to report and the project duration. Contact us: Tel. 0-2629-0191-6 · customer.service@thaiunique.com
For the products related to this article, see the Picarro G2508, LICA SF-9000, LICA PS-9600 and Picarro L2140-i pages.
The gas analyzers and chamber systems mentioned in this article are available in Thailand through Thai Unique, with installation, calibration and after-sales support teams based in the country.
Frequently asked questions
Can I collect samples in bottles and send them to a lab instead?
It depends on the purpose of the measurement. Collecting samples in bottles and measuring them later in the laboratory gives the amount at that moment. It can serve as baseline data, but only for a single point in time, so it cannot be used to measure flux. Bottle sampling gives only an amount, whereas flux is the amount per unit area per unit time. Bottle samples therefore lack time information, system parameter information, and information on the pressure and diffusion of the various soil matrices at that location.
How many gases can one instrument measure?
It depends on the model. Picarro G2508 measures five gases at once: N₂O, CH₄, CO₂, NH₃ and H₂O. LICA PS-9600 measures CH₄, CO₂ and H₂O with a CRDS laser, and SF-9000 focuses on CO₂ and H₂O for long-term monitoring. The right choice depends on which gases your project has to report.
Does a system installed in the field need someone on site?
No. Multi-chamber systems are designed to collect data continuously and log it to an SD card on their own. One example is the SF-9000, which connects 1–18 chambers and operates from -20 to 60 °C. What you need to plan is the power supply and the schedule of equipment inspection visits.
What precision is enough for N₂O work?
Atmospheric N₂O concentrations are low, so capturing the rate of increase in a chamber requires ppb-level precision. For example, the G2508 gives an N₂O precision of about 0.6 ppb at 5-minute averaging, which is enough to calculate the rate of increase over a short period.
How much does a complete system cost?
A flux measurement system has several parts: the analyzer, the number of chambers required, the power system and the software. The number of chambers and the gases to be reported affect the price the most. Send us the number of measurement points, the gases you need to report and the project duration, and we will put together a set that fits your work.